NetworkX
This Jupyter notebook provides an example of using the Python packages gravis and NetworkX. The .ipynb file can be found here.
References
Installation
Import
[1]:
import os
import networkx as nx
import networkx.algorithms.community
import matplotlib.pyplot as plt
import gravis as gv
Quick start
Example 1
Uses a graph stored in the package
Visualizes edge weights as line widths
[2]:
# Create a graph from a stored example
graph = nx.les_miserables_graph()
# It comes with an edge property named "weight" which can be used as edge size
gv.d3(graph, edge_size_data_source='weight', use_edge_size_normalization=True)
[2]:
Example 2
Uses a graph generator to create a random graph
Calculates quantitative measures (centralities) for nodes and edges
Infers structure (community detection) in the graph
Depicts the information by various visual elements
[3]:
def assign_properties(g):
# Centrality calculation
node_centralities = nx.eigenvector_centrality(g)
edge_centralities = nx.edge_betweenness_centrality(g)
# Community detection
communities = nx.algorithms.community.greedy_modularity_communities(g)
# Graph properties
g.graph['node_border_size'] = 1.5
g.graph['node_border_color'] = 'white'
g.graph['edge_opacity'] = 0.9
# Node properties: Size by centrality, shape by size, color by community
colors = ['red', 'blue', 'green', 'orange', 'pink', 'brown', 'yellow', 'cyan', 'magenta', 'violet']
for node_id in g.nodes:
node = g.nodes[node_id]
node['size'] = 10 + node_centralities[node_id] * 100
node['shape'] = 'rectangle' if node['size'] > 30 else 'circle'
for community_counter, community_members in enumerate(communities):
if node_id in community_members:
break
node['color'] = colors[community_counter % len(colors)]
# Edge properties: Size by centrality, color by community (within=community color, between=black)
for edge_id in g.edges:
edge = g.edges[edge_id]
source_node = g.nodes[edge_id[0]]
target_node = g.nodes[edge_id[1]]
edge['size'] = edge_centralities[edge_id] * 100
edge['color'] = source_node['color'] if source_node['color'] == target_node['color'] else 'black'
# Create a graph with a generator function
g = nx.powerlaw_cluster_graph(n=250, m=2, p=0.9)
# Assign node and edge properties
assign_properties(g)
# Plot it
gv.d3(g, zoom_factor=0.2)
[3]:
Graph construction
API reference: Graph creation
1) Manual graph construction
Tutorial: Creating a graph
API reference
1.a) Graph
undirected, with self-loops, without parallel edges, with attributes
[4]:
ug = nx.Graph()
# Node with automatic id
# ~ Not supported ~
# Node with user-defined id (=any hashable Python object except None)
ug.add_node('a')
# Node + attribute
ug.add_node('b', size=20)
# Node + attributes
ug.add_node('c', size=30, color='orange')
# Nodes
ug.add_nodes_from(['d', 'e']) # argument: iterable of user-defined ids
# Nodes + attributes
ug.add_nodes_from([
('f', {'size': 10, 'color': 'red'}),
('g', {'size': 15, 'color': 'blue'}),
('h', {'size': 20, 'color': 'green'})
])
# Edge (nodes may already exist but do not need to)
ug.add_edge('a', 'b')
# Edge + attribute
ug.add_edge('b', 'c', size=3)
# Edge + attributes
ug.add_edge('c', 'd', size=4, color='orange')
# Edges
ug.add_edges_from([('d', 'e'), ('e', 'f')])
# Edges + attributes
ug.add_edges_from([
('f', 'g', {'size': 2.2, 'color': 'red'}),
('g', 'h', {'size': 4.4, 'color': 'blue'}),
('h', 'a', {'size': 4.4, 'color': 'green'}),
('a', 'a'),
])
gv.d3(ug, graph_height=200)
[4]:
1.b) DiGraph
directed, with self-loops, without parallel edges, with attributes
[5]:
dg = nx.DiGraph(ug)
gv.d3(dg, graph_height=200)
[5]:
1.c) MultiGraph
undirected, with self-loops, with parallel edges, with attributes
[6]:
umg = nx.MultiGraph()
# Nodes
umg.add_nodes_from([
('a'),
('b', {'size': 20}),
('c', {'size': 30, 'color': 'orange'}),
('d'),
('e'),
('f', {'size': 10, 'color': 'red'}),
('g', {'size': 15, 'color': 'blue'}),
('h', {'size': 20, 'color': 'green'}),
])
# Edges
umg.add_edges_from([
('a', 'b'),
('b', 'c', {'size': 3}),
('c', 'd', {'size': 4, 'color': 'orange'}),
('d', 'e'),
('e', 'f'),
('f', 'g', {'size': 2.2, 'color': 'red'}),
('g', 'h', {'size': 4.4, 'color': 'blue'}),
('h', 'a', {'size': 4.4, 'color': 'green'}),
('a', 'a'),
('a', 'a'),
('a', 'b'),
('b', 'a'),
])
gv.d3(umg, graph_height=200, edge_curvature=0.8)
[6]:
1.d) MultiDiGraph
directed, with self-loops, with parallel edges, with attributes
[7]:
dmg = nx.MultiDiGraph(umg)
gv.d3(dmg, graph_height=200, edge_curvature=0.8)
[7]:
Assign attributes to a created graph
[8]:
g = nx.Graph()
g.add_edges_from([(0, 1), (1, 2), (2, 3), (3, 4), (4, 5), (5, 6), (6, 7), (7, 0)])
Graph attributes
[9]:
g.graph['background_color'] = 'gray'
g.graph['node_shape'] = 'rectangle'
g.graph['node_label_color'] = 'white'
g.graph['edge_opacity'] = 0.3
Node attributes
[10]:
# Nodes
for i, node_id in enumerate(g.nodes):
g.nodes[node_id]['size'] = 5 + i*5
g.nodes[node_id]['color'] = 'lightblue'
# Node
g.nodes[3]['color'] = 'darkred'
g.nodes[3]['shape'] = 'hexagon'
g.nodes[3]['size'] = 40
g.nodes[3]['opacity'] = 0.3
Edge attributes
[11]:
# Edges
for i, edge_id in enumerate(g.edges):
g.edges[edge_id]['size'] = 1 + i
g.edges[edge_id]['color'] = 'lightgreen'
# Edge
g.edges[(3, 4)]['size'] = 1
g.edges[(3, 4)]['color'] = 'darkred'
[12]:
gv.d3(g, graph_height=200)
[12]:
2) Algorithmic graph construction
Tutorial: Graph generators and operations
API reference: Graph generators
[13]:
n = 8
e = 12
[14]:
# Generators for classic graphs
g = nx.complete_graph(n)
g = nx.complete_bipartite_graph(n, n)
g = nx.barbell_graph(n, n)
g = nx.lollipop_graph(n, n)
# Stochastic graph generators
g = nx.erdos_renyi_graph(100, 0.15)
g = nx.watts_strogatz_graph(30, 3, 0.1)
g = nx.barabasi_albert_graph(100, 5)
g = nx.random_lobster(100, 0.9, 0.9)
# Nice for demonstrating community structures
g = nx.dorogovtsev_goltsev_mendes_graph(n)
g = nx.connected_caveman_graph(l=5, k=6)
# Nice for demonstrating forces (and node degree centrality)
g = nx.star_graph(n)
g = nx.wheel_graph(n)
g = nx.turan_graph(n, 2)
g = nx.complete_graph(n)
# Nice for demonstrating edge betweenness
g = nx.barbell_graph(n, 1)
g = nx.hexagonal_lattice_graph(3, 4)
g = nx.triangular_lattice_graph(4, 8)
# Random graphs
g = nx.erdos_renyi_graph(n=n, p=0.02)
g = nx.fast_gnp_random_graph(n=n, p=2/1000)
g = nx.newman_watts_strogatz_graph(n=n, k=5, p=0.05)
g = nx.watts_strogatz_graph(n=n, k=5, p=0.3)
g = nx.barabasi_albert_graph(n=n, m=2)
g = nx.dual_barabasi_albert_graph(n=n, m1=1, m2=2, p=0.6)
g = nx.powerlaw_cluster_graph(n=n, m=2, p=0.7)
g = nx.random_lobster(n=n, p1=0.95, p2=0.75)
g = nx.duplication_divergence_graph(n=n, p=0.4)
g = nx.havel_hakimi_graph(deg_sequence=[6]*10+[4]*10)
# Geometrically nice layouts (reminding of soap bubble physics)
g = nx.dodecahedral_graph()
g = nx.moebius_kantor_graph()
g = nx.circular_ladder_graph(n)
g = nx.circulant_graph(n, [2, 1])
g = nx.lollipop_graph(n, 5)
[15]:
# Directed
g = nx.directed_havel_hakimi_graph(in_deg_sequence=[2]*20+[3]*10+[2]*10, out_deg_sequence=[2]*30+[3]*10)
3) Graph loading from an internal collection
API reference: Graph generators
Book: An atlas of graphs (“Graph atlas”)
[16]:
# Graph atlas
g = nx.graph_atlas(986)
# Classical small graphs
g = nx.cubical_graph()
g = nx.diamond_graph()
g = nx.dodecahedral_graph()
g = nx.icosahedral_graph()
g = nx.octahedral_graph()
g = nx.tetrahedral_graph()
g = nx.truncated_cube_graph()
g = nx.truncated_tetrahedron_graph()
g = nx.bull_graph()
g = nx.chvatal_graph()
g = nx.desargues_graph()
g = nx.frucht_graph()
g = nx.heawood_graph()
g = nx.hoffman_singleton_graph()
g = nx.house_graph()
g = nx.house_x_graph()
g = nx.krackhardt_kite_graph()
g = nx.moebius_kantor_graph()
g = nx.pappus_graph()
g = nx.petersen_graph()
g = nx.sedgewick_maze_graph()
g = nx.tutte_graph()
# Social networks
g = nx.les_miserables_graph()
g = nx.karate_club_graph()
g = nx.davis_southern_women_graph()
g = nx.florentine_families_graph()
4) Graph import and export
Import
[17]:
filepath = os.path.join('data', 'networkx_graph.gml')
g = nx.read_gml(filepath)
# methods for other formats
nx.read_adjlist
nx.read_multiline_adjlist
nx.read_edgelist
nx.read_gexf
nx.read_gpickle
nx.read_graphml
nx.json_graph.adjacency_graph
nx.json_graph.cytoscape_graph
nx.json_graph.node_link_graph
nx.json_graph.jit_graph
nx.json_graph.tree_graph
nx.read_leda
nx.read_pajek
nx.read_shp
[17]:
<function networkx.readwrite.nx_shp.read_shp(path, simplify=True, geom_attrs=True, strict=True)>
Export
[18]:
filepath = os.path.join('data', 'networkx_graph.gml')
nx.write_gml(g, filepath)
# methods for other formats
nx.write_adjlist
nx.write_multiline_adjlist
nx.write_edgelist
nx.write_gexf
nx.write_gpickle
nx.write_graphml
nx.write_pajek
nx.write_shp
[18]:
<function networkx.readwrite.nx_shp.write_shp(G, outdir)>
5) Graph modification that results in a new graph
API reference: Operators
Basic graph inspection
API reference: Graph reporting
1) Graph and its properties
[19]:
g = nx.les_miserables_graph()
print('Type:', type(g))
print('Directed:', g.is_directed())
print('Number of nodes:', g.number_of_nodes())
print('Number of edges:', g.number_of_edges())
print('Attributes:', g.graph)
Type: <class 'networkx.classes.graph.Graph'>
Directed: False
Number of nodes: 77
Number of edges: 254
Attributes: {}
2) Nodes and their properties
[20]:
for node in g.nodes:
attributes = g.nodes[node]
degree = g.degree(node)
print('Type:', type(node), type(attributes))
print('Id:', node)
print('Attributes:', attributes)
print('Degree:', degree)
break
print()
for node, attributes in g.nodes.data():
print('Type:', type(node), type(attributes))
print('Id:', node)
print('Attributes:', attributes)
break
Type: <class 'str'> <class 'dict'>
Id: Napoleon
Attributes: {}
Degree: 1
Type: <class 'str'> <class 'dict'>
Id: Napoleon
Attributes: {}
3) Edges and their properties
[21]:
for edge in g.edges:
source, target = edge
attributes = g.edges[edge]
print('Type:', type(source), type(target), type(attributes))
print('Source:', source)
print('Target:', target)
print('Attributes:', )
break
print()
for source, target, attributes in g.edges.data():
print('Type:', type(source), type(target), type(attributes))
print('Source:', source)
print('Target:', target)
print('Attributes:', attributes)
break
Type: <class 'str'> <class 'str'> <class 'dict'>
Source: Napoleon
Target: Myriel
Attributes:
Type: <class 'str'> <class 'str'> <class 'dict'>
Source: Napoleon
Target: Myriel
Attributes: {'weight': 1}
Calculating graph measures and metrics
Tutorial: Analyzing graphs
API reference: Algorithms
Centrality
API reference
[22]:
g = nx.barbell_graph(8, 1)
dg = nx.directed_havel_hakimi_graph([1, 1, 2, 3, 3], [1, 1, 2, 3, 3])
Graph measures: single scalar value
[23]:
scalar = nx.estrada_index(g)
scalar = nx.global_reaching_centrality(g)
Node measures: dict (node -> value)
[24]:
node_dict = nx.degree_centrality(g)
node_dict = nx.in_degree_centrality(dg)
node_dict = nx.out_degree_centrality(dg)
node_dict = nx.eigenvector_centrality(g)
node_dict = nx.eigenvector_centrality_numpy(g)
node_dict = nx.katz_centrality(g)
node_dict = nx.katz_centrality_numpy(g)
node_dict = nx.closeness_centrality(g)
#nx.incremental_closeness_centrality(g)
node_dict = nx.current_flow_closeness_centrality(g)
node_dict = nx.information_centrality(g)
node_dict = nx.betweenness_centrality(g)
node_dict = nx.current_flow_betweenness_centrality(g)
node_dict = nx.approximate_current_flow_betweenness_centrality(g)
node_dict = nx.communicability_betweenness_centrality(g)
node_dict = nx.load_centrality(g)
node_dict = nx.subgraph_centrality(g)
node_dict = nx.subgraph_centrality_exp(g)
node_dict = nx.harmonic_centrality(g)
#nx.percolation_centrality(g)
node_dict = nx.second_order_centrality(g)
[25]:
node_dict_dict = nx.dispersion(g)
node_list = nx.voterank(g)
Edge measures: dict (edge -> value)
[26]:
edge_dict = nx.edge_betweenness_centrality(g)
edge_dict = nx.edge_current_flow_betweenness_centrality(g)
edge_dict = nx.edge_load_centrality(g)
[27]:
node_dict = nx.pagerank(g)
node_np_matrix = nx.google_matrix(g)
node_tuple_dict = nx.hits(g)
node_np_matrix = nx.hub_matrix(g)
node_np_matrix = nx.authority_matrix(g)
[28]:
node_dict = nx.closeness_vitality(g) # value can be -inf
Groups of nodes
Cliques
API reference: Clique
[29]:
# TODO
Cores
API reference: Cores
[30]:
# TODO
Components
API reference
[31]:
# TODO
Communities
API reference
-
Modularity matrix
Spectrum
[32]:
g = nx.barbell_graph(8, 1)
# TODO
Partitions via centrality measures
Girvan–Newman method
[33]:
generator = networkx.algorithms.community.girvan_newman(g)
result1 = next(generator)
result2 = next(generator)
result3 = next(generator)
print(result1)
print(result2)
print(result3)
({0, 1, 2, 3, 4, 5, 6, 7}, {8, 9, 10, 11, 12, 13, 14, 15, 16})
({0, 1, 2, 3, 4, 5, 6, 7}, {9, 10, 11, 12, 13, 14, 15, 16}, {8})
({0}, {1, 2, 3, 4, 5, 6, 7}, {9, 10, 11, 12, 13, 14, 15, 16}, {8})
[34]:
for node_id in g.nodes:
g.nodes[node_id]["color"] = 'red' if node_id in result2[0] else 'green' if node_id in result2[1] else 'blue'
gv.d3(g, use_y_positioning_force=True)
[34]:
Clauset-Newman-Moore greedy modularity maximization
[35]:
result = networkx.algorithms.community.greedy_modularity_communities(g)
result
[35]:
[frozenset({0, 1, 2, 3, 4, 5, 6, 7, 8}),
frozenset({9, 10, 11, 12, 13, 14, 15, 16})]
Bisection: Partition a graph into two blocks
Kernighan–Lin algorithm
[36]:
result = networkx.algorithms.community.kernighan_lin_bisection(g)
result
[36]:
({0, 1, 2, 3, 4, 5, 6, 7}, {8, 9, 10, 11, 12, 13, 14, 15, 16})
Find k-clique communities
percolation method
[37]:
iterator = networkx.algorithms.community.k_clique_communities(g, 3)
result = list(iterator)
result
[37]:
[frozenset({0, 1, 2, 3, 4, 5, 6, 7}),
frozenset({9, 10, 11, 12, 13, 14, 15, 16})]
Label propagation
Asynchronous label propagation
[38]:
# TODO: networkx.algorithms.community.asyn_lpa_communities(g)
[39]:
generator = networkx.algorithms.community.label_propagation_communities(g)
result = list(generator)
result
[39]:
[{0, 1, 2, 3, 4, 5, 6, 7, 8, 9, 10, 11, 12, 13, 14, 15, 16}]
Fluid Communities
Asynchronous Fluid Communities algorithm
[40]:
iterator = networkx.algorithms.community.asyn_fluidc(g, k=3)
result = list(iterator)
result
[40]:
[{9, 10, 11, 12, 13, 14, 15, 16}, {7, 8}, {0, 1, 2, 3, 4, 5, 6}]
[41]:
for node_id in g.nodes:
g.nodes[node_id]["color"] = 'red' if node_id in result[0] else 'green' if node_id in result[1] else 'blue'
gv.d3(g, use_y_positioning_force=True)
[41]:
Validation of partitions
[42]:
networkx.algorithms.community.is_partition(g, result3)
[42]:
True
Quality measure of partitions
[43]:
networkx.algorithms.community.coverage(g, result3)
[43]:
0.8448275862068966
[44]:
networkx.algorithms.community.performance(g, result3)
[44]:
0.9338235294117647
[45]:
nx.connected_components(g)
nx.clustering(g)
nx.all_pairs_shortest_path(g)
[45]:
<generator object all_pairs_shortest_path at 0x7ff1f7347950>
Paths and distances
API reference
[46]:
# TODO
Global properties
API reference
[47]:
# TODO
Graph visualization
Tutorial: Drawing graphs
API reference
Layout calculation
API reference: Graph layout
[48]:
graph = nx.les_miserables_graph()
layout = nx.circular_layout(graph, scale=500)
#layout = nx.kamada_kawai_layout(graph, scale=500)
#layout = nx.spring_layout(graph, scale=500)
for node_id, (x, y) in layout.items():
node = graph.nodes[node_id]
node['x'] = x
node['y'] = y
gv.d3(graph, layout_algorithm_active=False, show_menu=False)
[48]:
Plotting
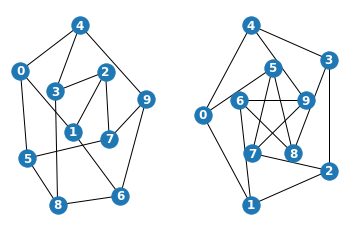
[49]:
g = nx.petersen_graph()
plt.subplot(121)
nx.draw(g, with_labels=True, font_weight='bold', font_color='white')
plt.subplot(122)
nx.draw_shell(g, nlist=[range(5, 10), range(5)], with_labels=True, font_weight='bold', font_color='white')
Further topics
Graph comparison